Onboarding A/B Experiment
Onboarding A/B Experiment
Onboarding A/B Experiment
Product & Experimentation
Completion went from 52.8% to 61.8%, a lift of 17.0%, and almost all of it came from new users.
Completion went from 52.8% to 61.8%, a lift of 17.0%, and almost all of it came from new users.
Completion went from 52.8% to 61.8%, a lift of 17.0%, and almost all of it came from new users.
Why
I wanted to run an experiment end to end rather than analyze someone else's. Building the simulation myself in Python meant I set the ground truth, so I could check whether the test actually recovered an effect I knew was there instead of guessing whether a real world result was luck.
Setup
I modeled an onboarding flow with several sequential steps and randomly assigned 10,000 simulated users to a control group with no progress bar or a treatment group with one. Step to step transitions were probabilistic and parameterized separately for new and returning users, so the two segments could drift apart. Control ended up with 4,936 users and treatment with 5,064.
What happened
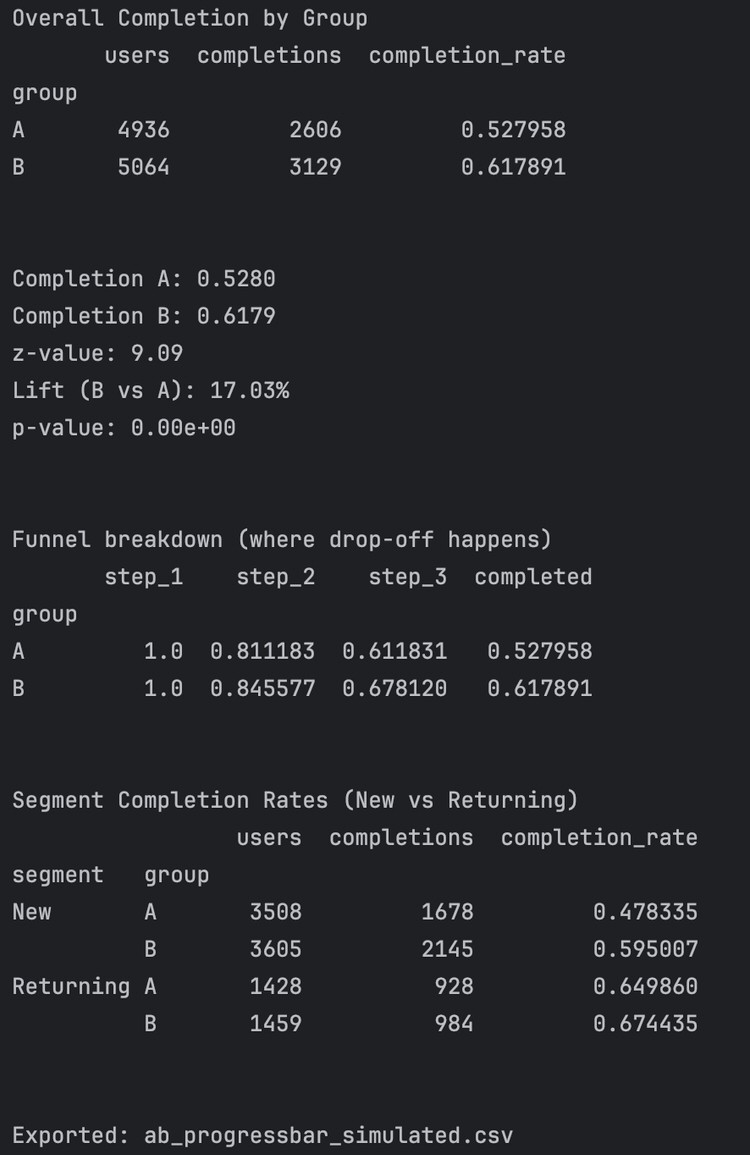
Control completed at 52.8% and treatment at 61.8%, with a z-value of 9.09 from a two-proportion z-test and a p-value that rounded to zero. Most of the gap showed up at step three. The two groups were close through the first two steps, 81.1% against 84.6% at step two, then control fell to 61.2% at step three while treatment held at 67.8%. The progress bar was keeping them from quitting partway through.
The segment split
The pooled number would have been misleading on its own. New users went from 47.8% to 59.5%. Returning users went from 65.0% to 67.4%. Returning users already knew the flow and had far less room to improve, so shipping to everyone on the strength of the overall figure would have added a step for the group that did not need one.
What I recommended
Roll out the progress bar to new users only. That is where the activation gain showed up, and the returning user flow does not need it.
What I would do differently
This was a simulation, so the result is only as good as the assumptions I fed it. I wrote the assumptions for how users move through the funnel, which means the lift measures my own logic rather than what real people do. If I ran this on an actual product, I would keep watching for a few weeks to see whether the improvement held once the progress bar stopped being new.
Why
I wanted to run an experiment end to end rather than analyze someone else's. Building the simulation myself in Python meant I set the ground truth, so I could check whether the test actually recovered an effect I knew was there instead of guessing whether a real world result was luck.
Setup
I modeled an onboarding flow with several sequential steps and randomly assigned 10,000 simulated users to a control group with no progress bar or a treatment group with one. Step to step transitions were probabilistic and parameterized separately for new and returning users, so the two segments could drift apart. Control ended up with 4,936 users and treatment with 5,064.
What happened
Control completed at 52.8% and treatment at 61.8%, with a z-value of 9.09 from a two-proportion z-test and a p-value that rounded to zero. Most of the gap showed up at step three. The two groups were close through the first two steps, 81.1% against 84.6% at step two, then control fell to 61.2% at step three while treatment held at 67.8%. The progress bar was keeping them from quitting partway through.
The segment split
The pooled number would have been misleading on its own. New users went from 47.8% to 59.5%. Returning users went from 65.0% to 67.4%. Returning users already knew the flow and had far less room to improve, so shipping to everyone on the strength of the overall figure would have added a step for the group that did not need one.
What I recommended
Roll out the progress bar to new users only. That is where the activation gain showed up, and the returning user flow does not need it.
What I would do differently
This was a simulation, so the result is only as good as the assumptions I fed it. I wrote the assumptions for how users move through the funnel, which means the lift measures my own logic rather than what real people do. If I ran this on an actual product, I would keep watching for a few weeks to see whether the improvement held once the progress bar stopped being new.
Why
I wanted to run an experiment end to end rather than analyze someone else's. Building the simulation myself in Python meant I set the ground truth, so I could check whether the test actually recovered an effect I knew was there instead of guessing whether a real world result was luck.
Setup
I modeled an onboarding flow with several sequential steps and randomly assigned 10,000 simulated users to a control group with no progress bar or a treatment group with one. Step to step transitions were probabilistic and parameterized separately for new and returning users, so the two segments could drift apart. Control ended up with 4,936 users and treatment with 5,064.
What happened
Control completed at 52.8% and treatment at 61.8%, with a z-value of 9.09 from a two-proportion z-test and a p-value that rounded to zero. Most of the gap showed up at step three. The two groups were close through the first two steps, 81.1% against 84.6% at step two, then control fell to 61.2% at step three while treatment held at 67.8%. The progress bar was keeping them from quitting partway through.
The segment split
The pooled number would have been misleading on its own. New users went from 47.8% to 59.5%. Returning users went from 65.0% to 67.4%. Returning users already knew the flow and had far less room to improve, so shipping to everyone on the strength of the overall figure would have added a step for the group that did not need one.
What I recommended
Roll out the progress bar to new users only. That is where the activation gain showed up, and the returning user flow does not need it.
What I would do differently
This was a simulation, so the result is only as good as the assumptions I fed it. I wrote the assumptions for how users move through the funnel, which means the lift measures my own logic rather than what real people do. If I ran this on an actual product, I would keep watching for a few weeks to see whether the improvement held once the progress bar stopped being new.